Detecting and Mitigating Biased Visual Analysis Strategies
SUMMARY
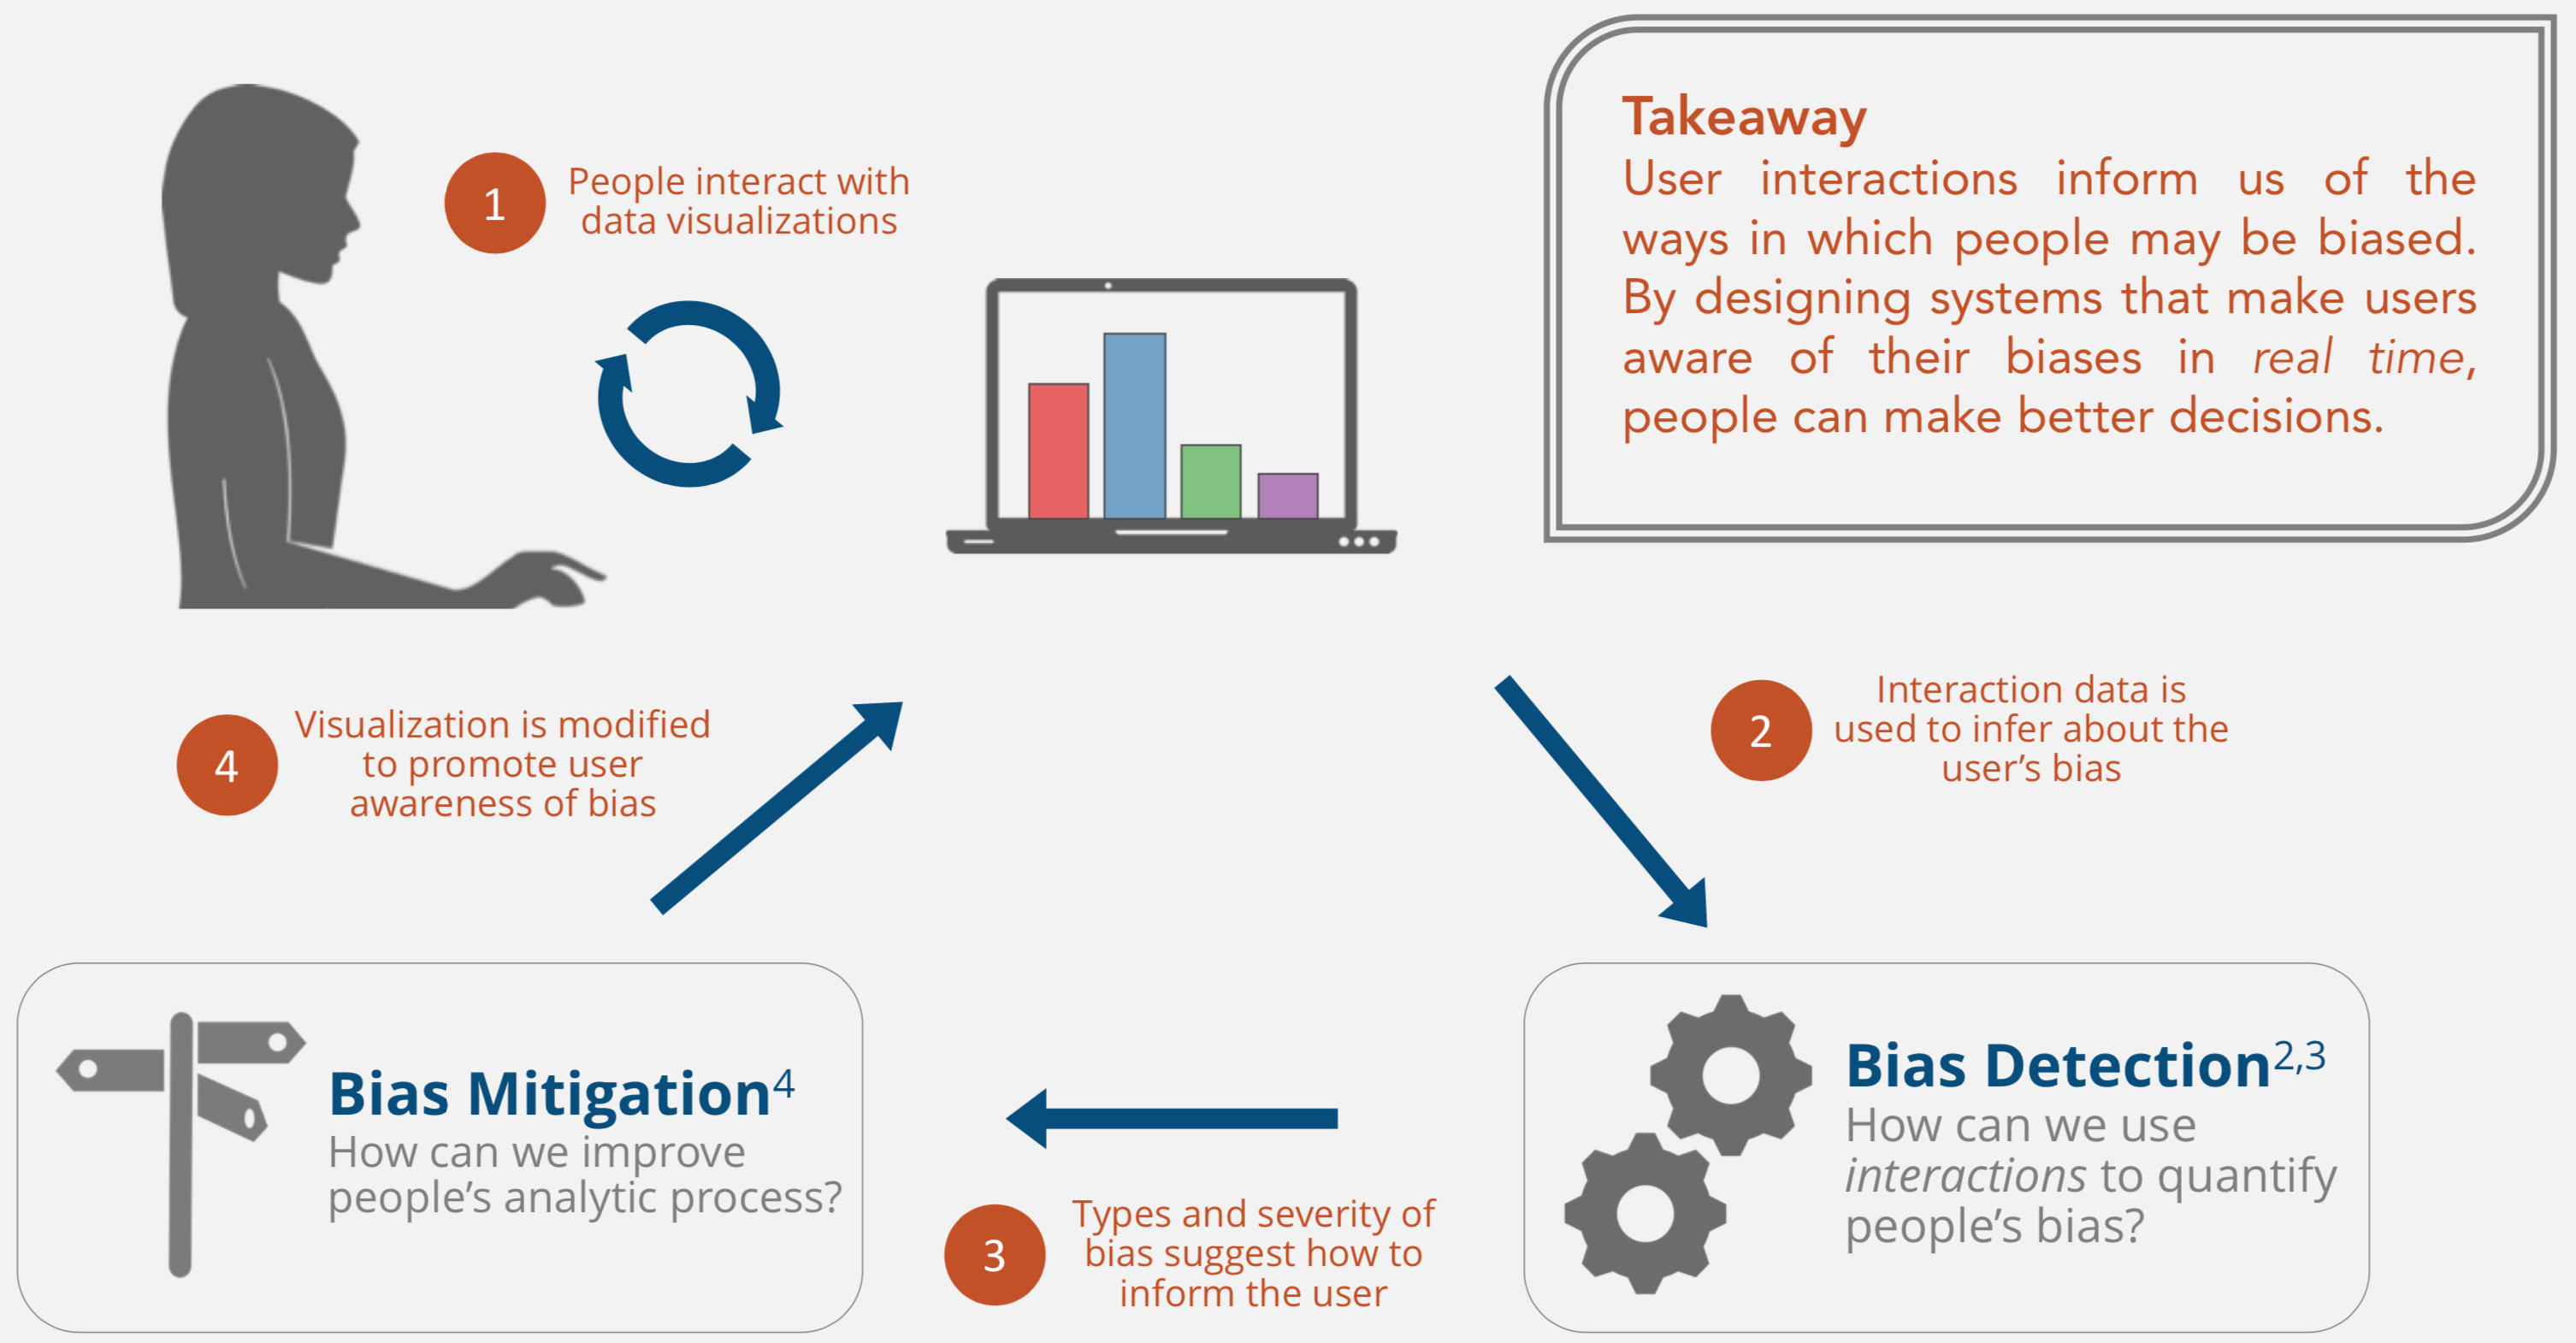
People make important decisions based on data every day, from simple choices such as which restaurant to dine at when visiting a city, to important and complex decisions in healthcare about which course of treatment to pursue, and even decisions that impact national security and policy. Visual analytic systems play a critical role in these decision-making processes. They allow people to interact with their data and analytic models to view different perspectives of data and gain insights. This interactive data analysis process consists of people incrementally guiding analytic models to produce alternate views of the data in support of their tasks. In most cases, such human-in-the-loop processes have successful, insightful outcomes. However, the cognitive sciences tell us that people can exhibit innate biased behavior. As a result, their data analysis behaviors and strategies may suffer. Ultimately, this could lead to decisions made from incomplete information and limited perspectives on how the data can be interpreted. Biased analysis processes can lead to biased results and misinformation. This project will perform fundamental research to discover how to detect such potential bias and develop visual analytic systems that mitigate it. It will also produce educational impacts for graduate and undergraduate students from groups underrepresented in STEM fields, in part through outreach workshops with instructors from minority-serving institutions and historically black colleges and universities to help them integrate visual analytics and general data literacy learning objectives into course curricula.
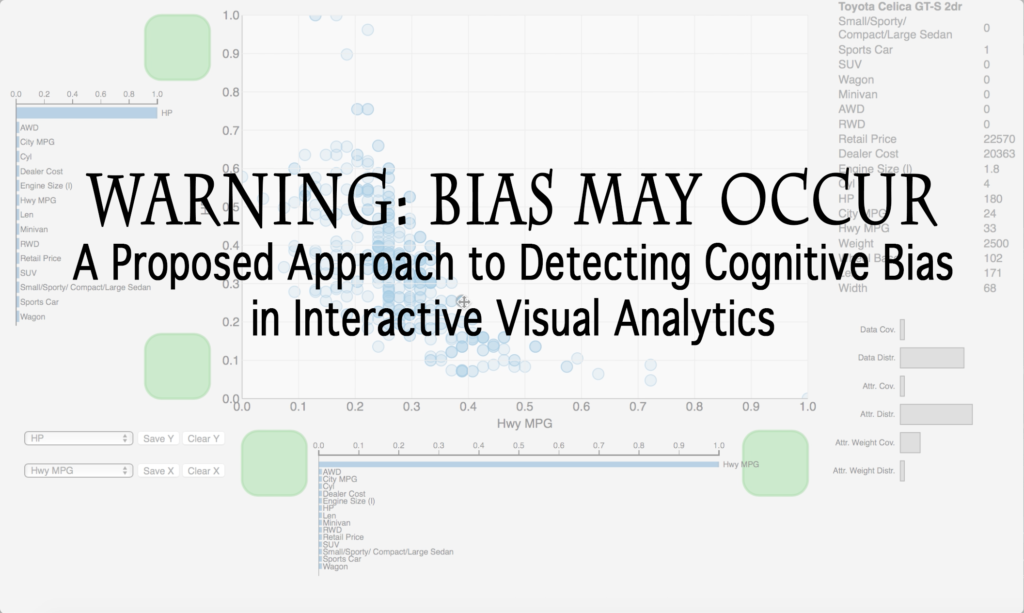
The proposed multi-disciplinary research will develop techniques that enhance mixed-initiative visual analytic analysis processes by intervening and providing guidance when necessary. To accomplish this goal, three primary lines of research are proposed. First, the team will develop and evaluate computational metrics to detect poor and potentially biased analysis strategies from user interaction patterns and system parameters. These metrics consist of probabilistic computational models that take into consideration metrics such as data coverage over the duration of the data exploration. Second, the team will develop and study different visual analytic system designs to guide and improve people's analysis processes. Each prototype will give people guidance using the metrics, but display information to users via different interface designs (e.g., dialog boxes, visual overlays of coverage, etc.) They will be developed, evaluated, and made available via publications and open-source code. Third, the studies proposed will generate empirical results and design guidelines for future mixed-initiative visual analytic systems.
NEWS
- Emily Wall has been awarded the D.E. Shaw Exploration Fellowship
- Emily Wall has been awarded the Siemens FutureMaker Fellowship
PUBLICATIONS
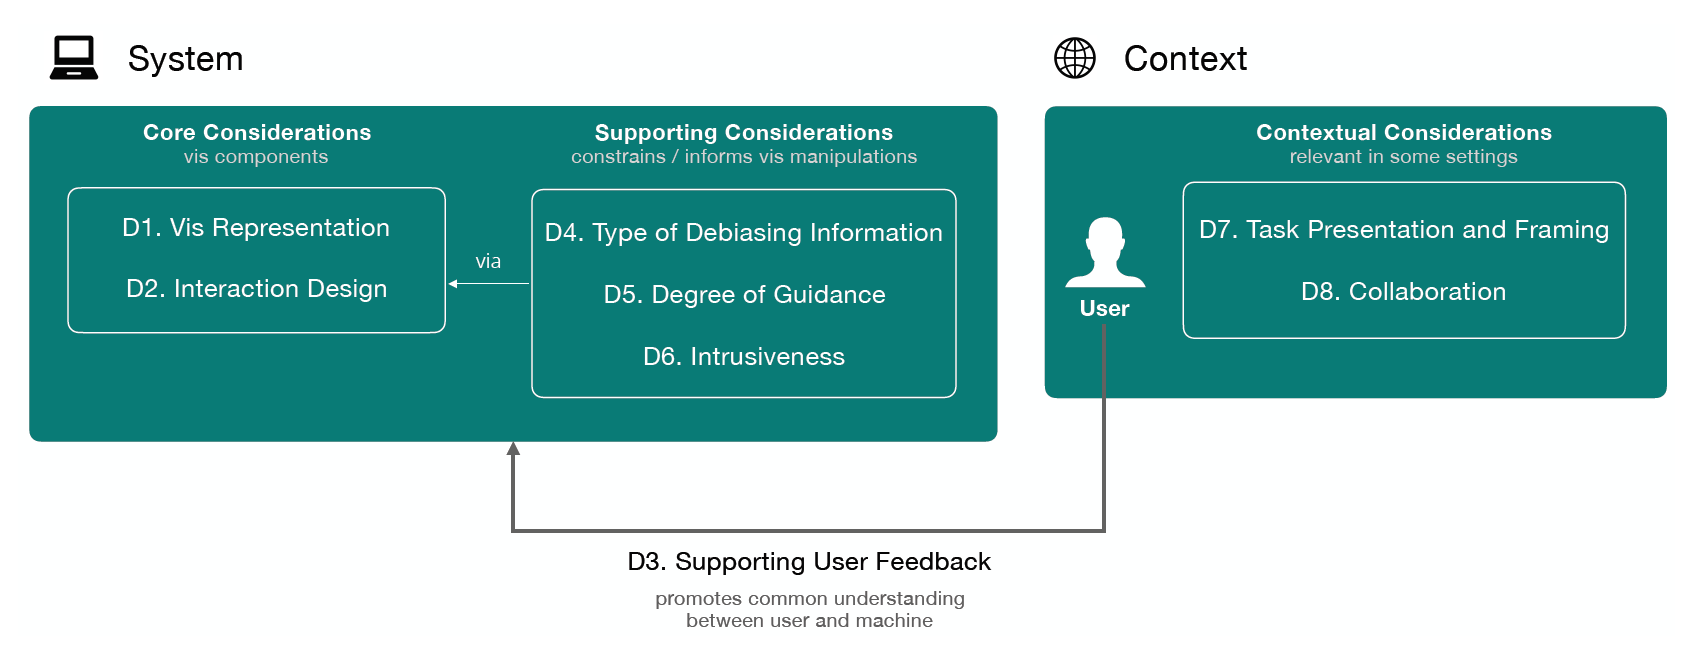
Toward a Design Space for Mitigating Cognitive Bias in Vis
IEEE Information Visualization (VIS) Short Papers, 2019
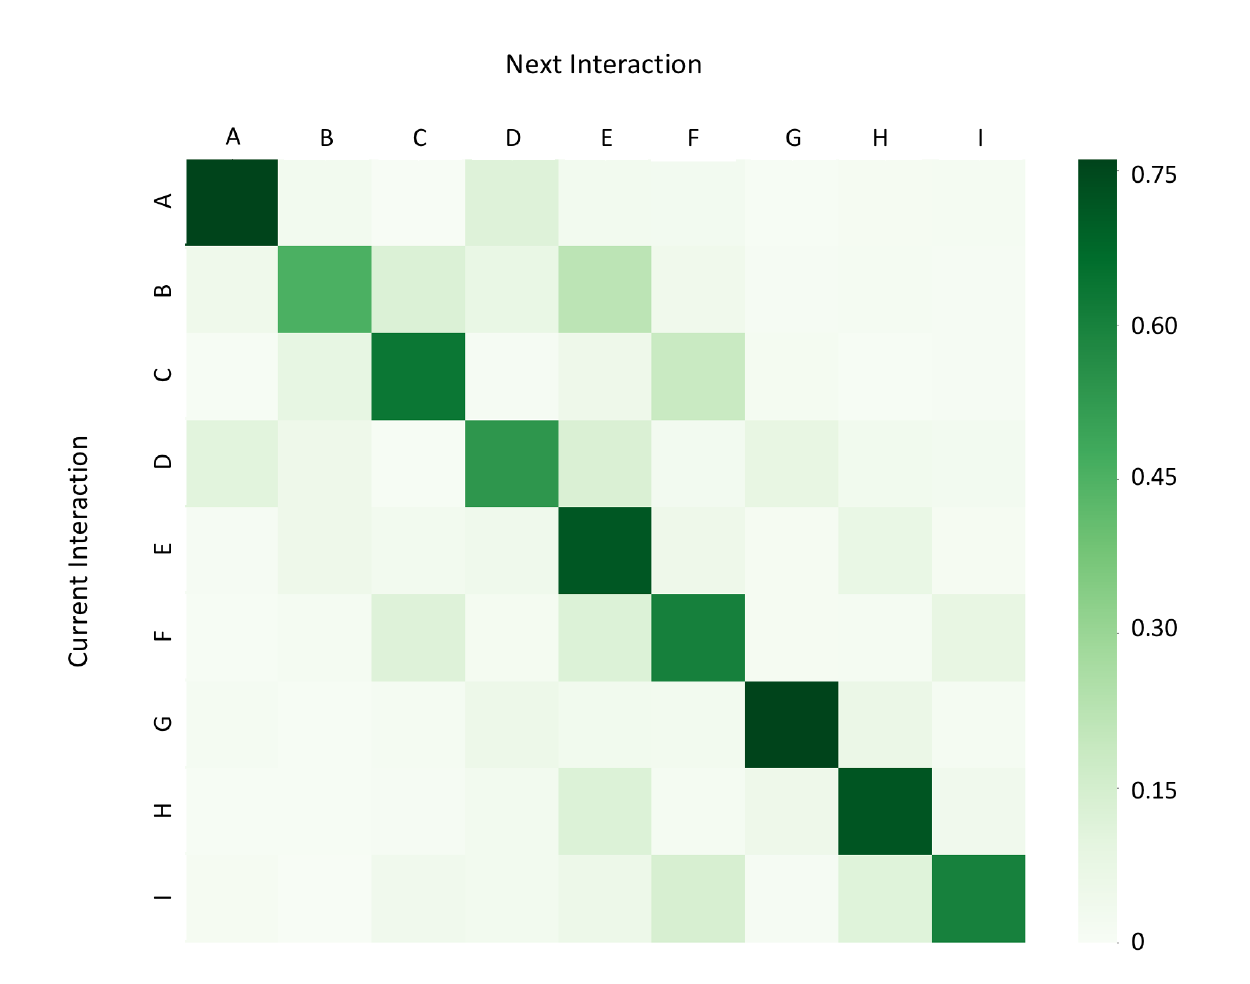
A Markov Model of Users' Interactive Behavior in Scatterplots
IEEE Information Visualization (VIS) Short Papers, 2019
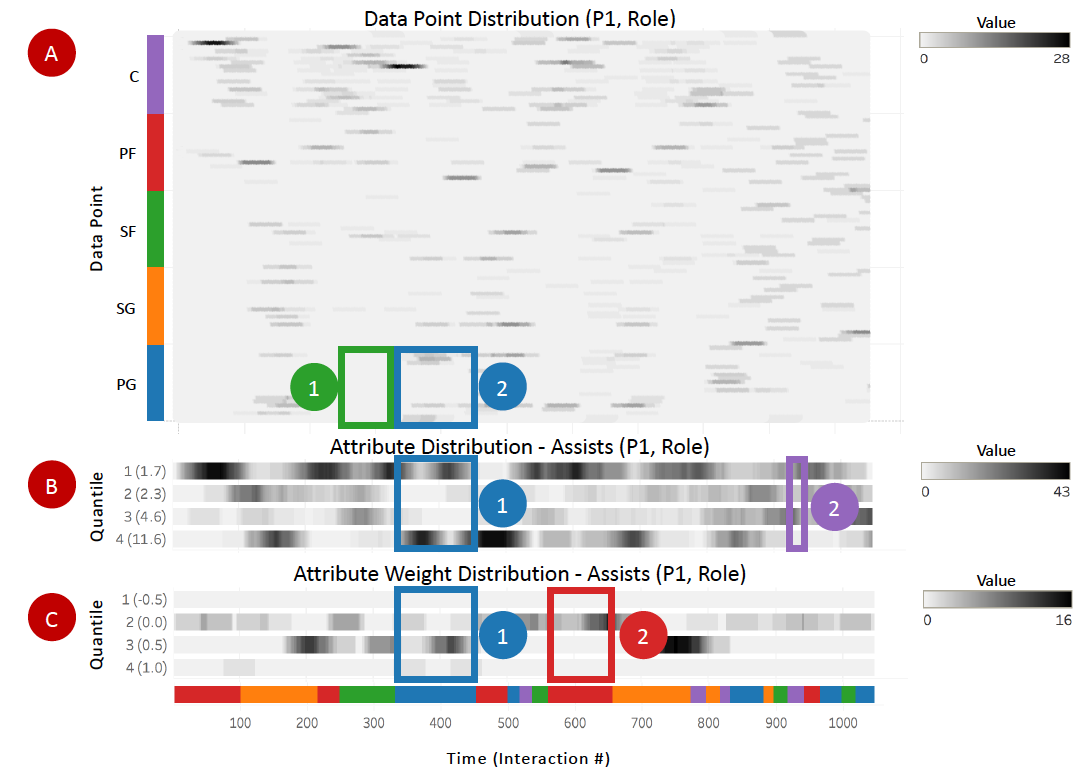

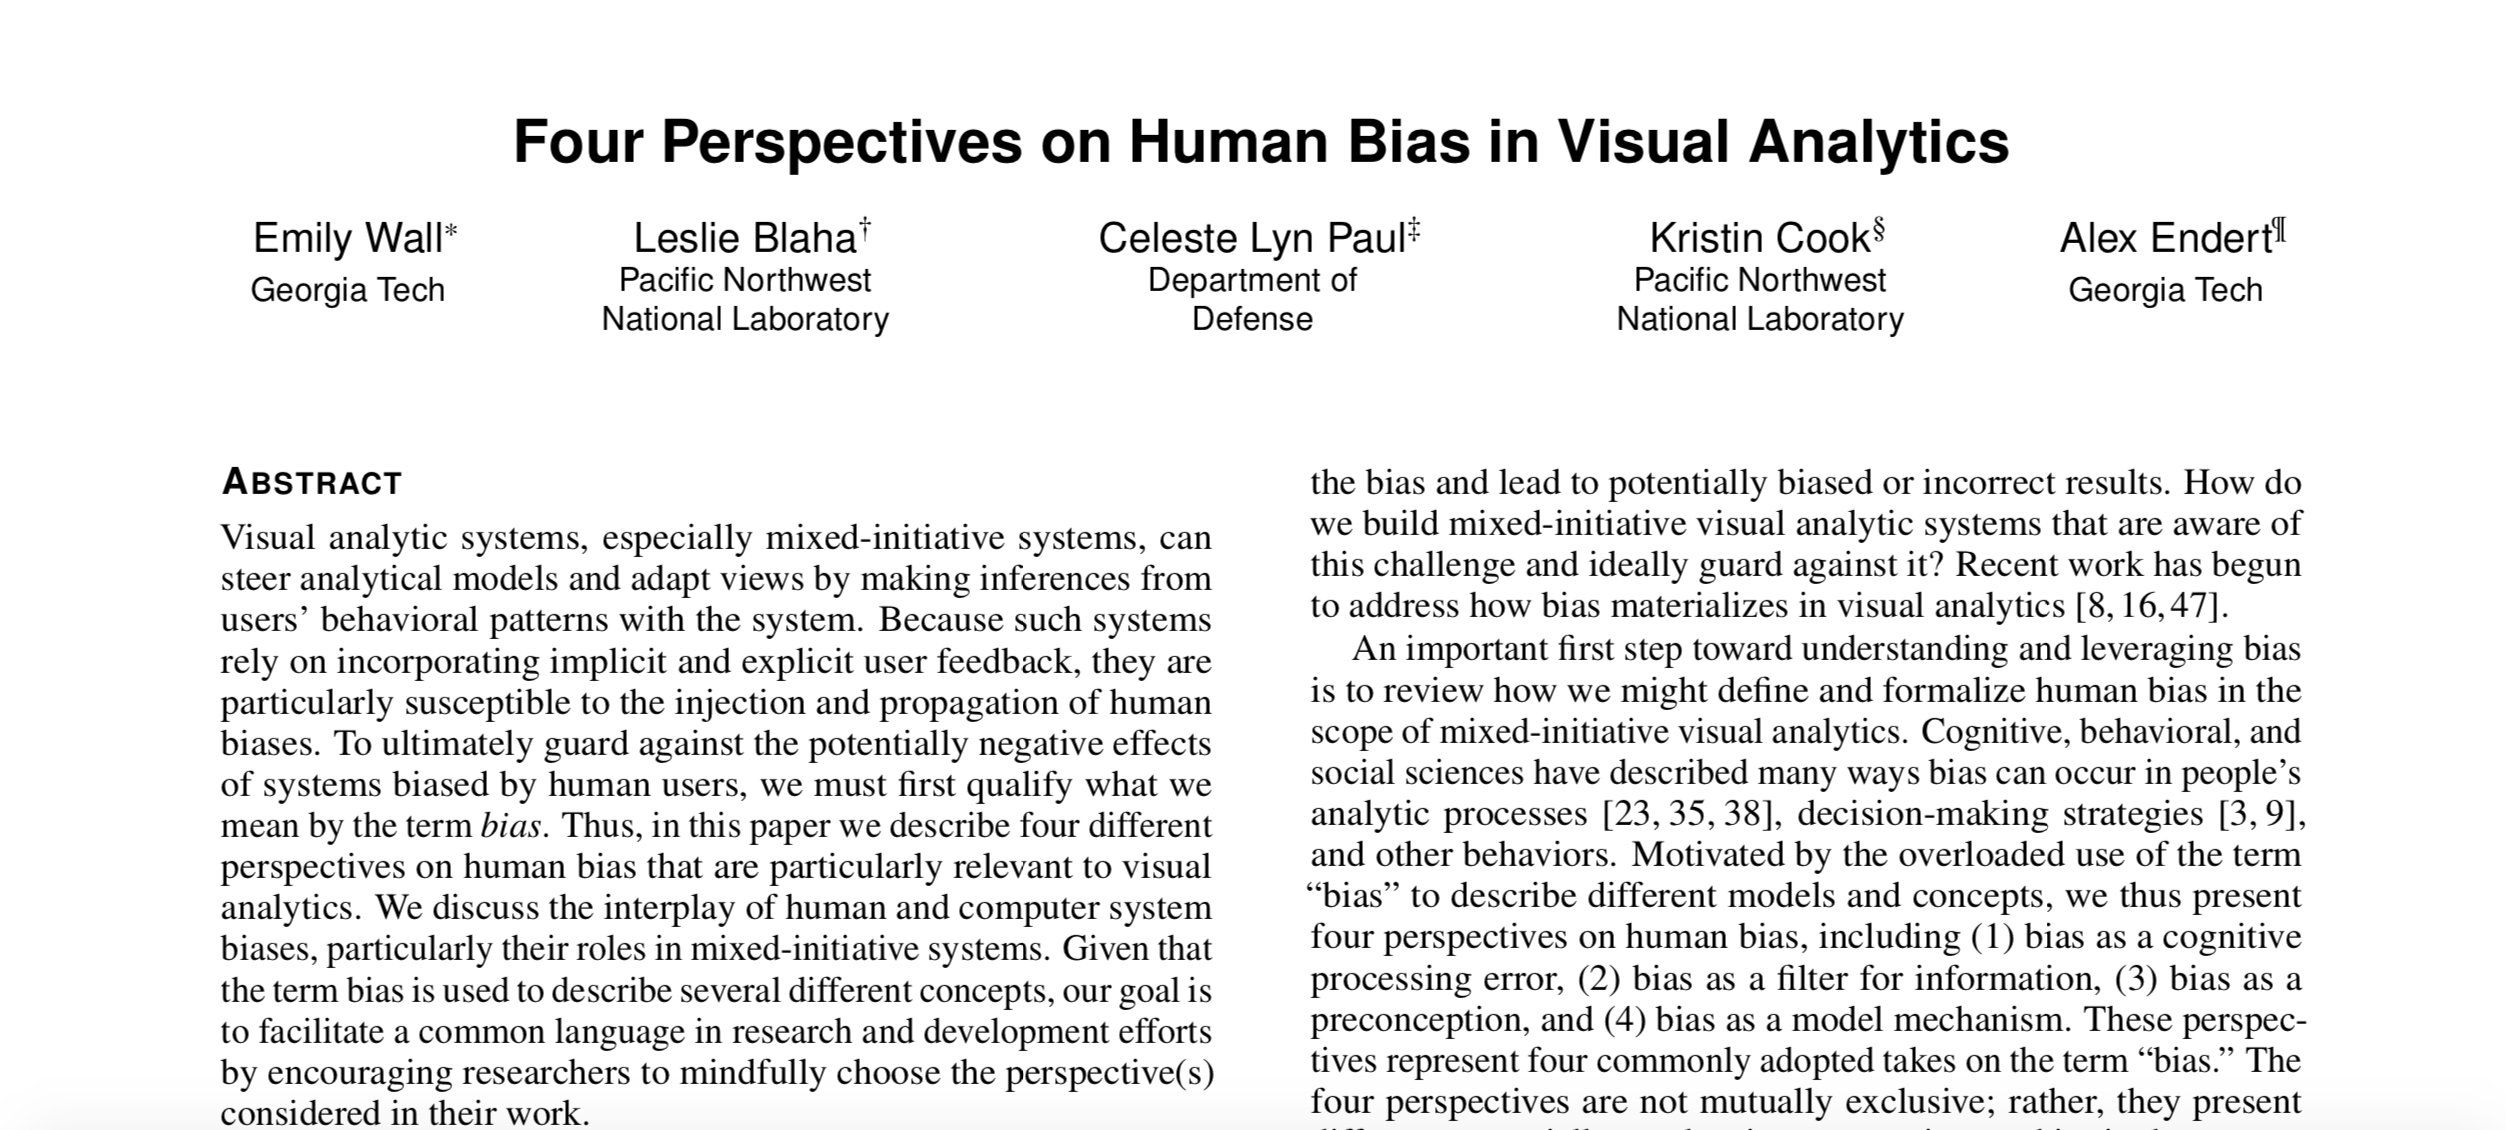
Four Perspectives on Human Bias in Visual Analytics
DECISIVe: Workshop on Dealing with Cognitive Biases in Visualizations (at IEEE VIS'17), 2017
PROJECT INFORMATION

Title: CHS: Small: Enhancing Data Analysis Strategies with Mixed-Initiative Visual Analytics
Duration: 8/2018 - 8/2021
PI: Alex Endert
Students: Emily Wall
Last updated: November 1, 2019