Visual Analytics by Demonstration for Interactive Data Analysis
SUMMARY
In today's data-driven era, more people analyze data as part of their daily lives. Visual analytic technologies help people in a variety of these domains including business, health, education, national security, and many more. These visual analytic techniques are effective since they combine powerful machine learning with interactive data visualization. Currently, the way that people use such systems is through user interfaces with control panels to adjust parameters of the analytic models and visualization properties directly. For example, controls may ask users to select which analytic model to use, which parameter to adjust, and by how much. However, when people do not have the necessary expertise or training in data science or information visualization, they may not be able to properly use these tools and miss out on important insights. Instead, this project will explore, design, develop, and evaluate techniques that allow people to demonstrate their analytic goals, tasks, and operations. Developing this "visual analytics by demonstration" method of user interaction has the potential to impact numerous data-driven domains, and society more broadly. This project will also provide educational experience and research training for
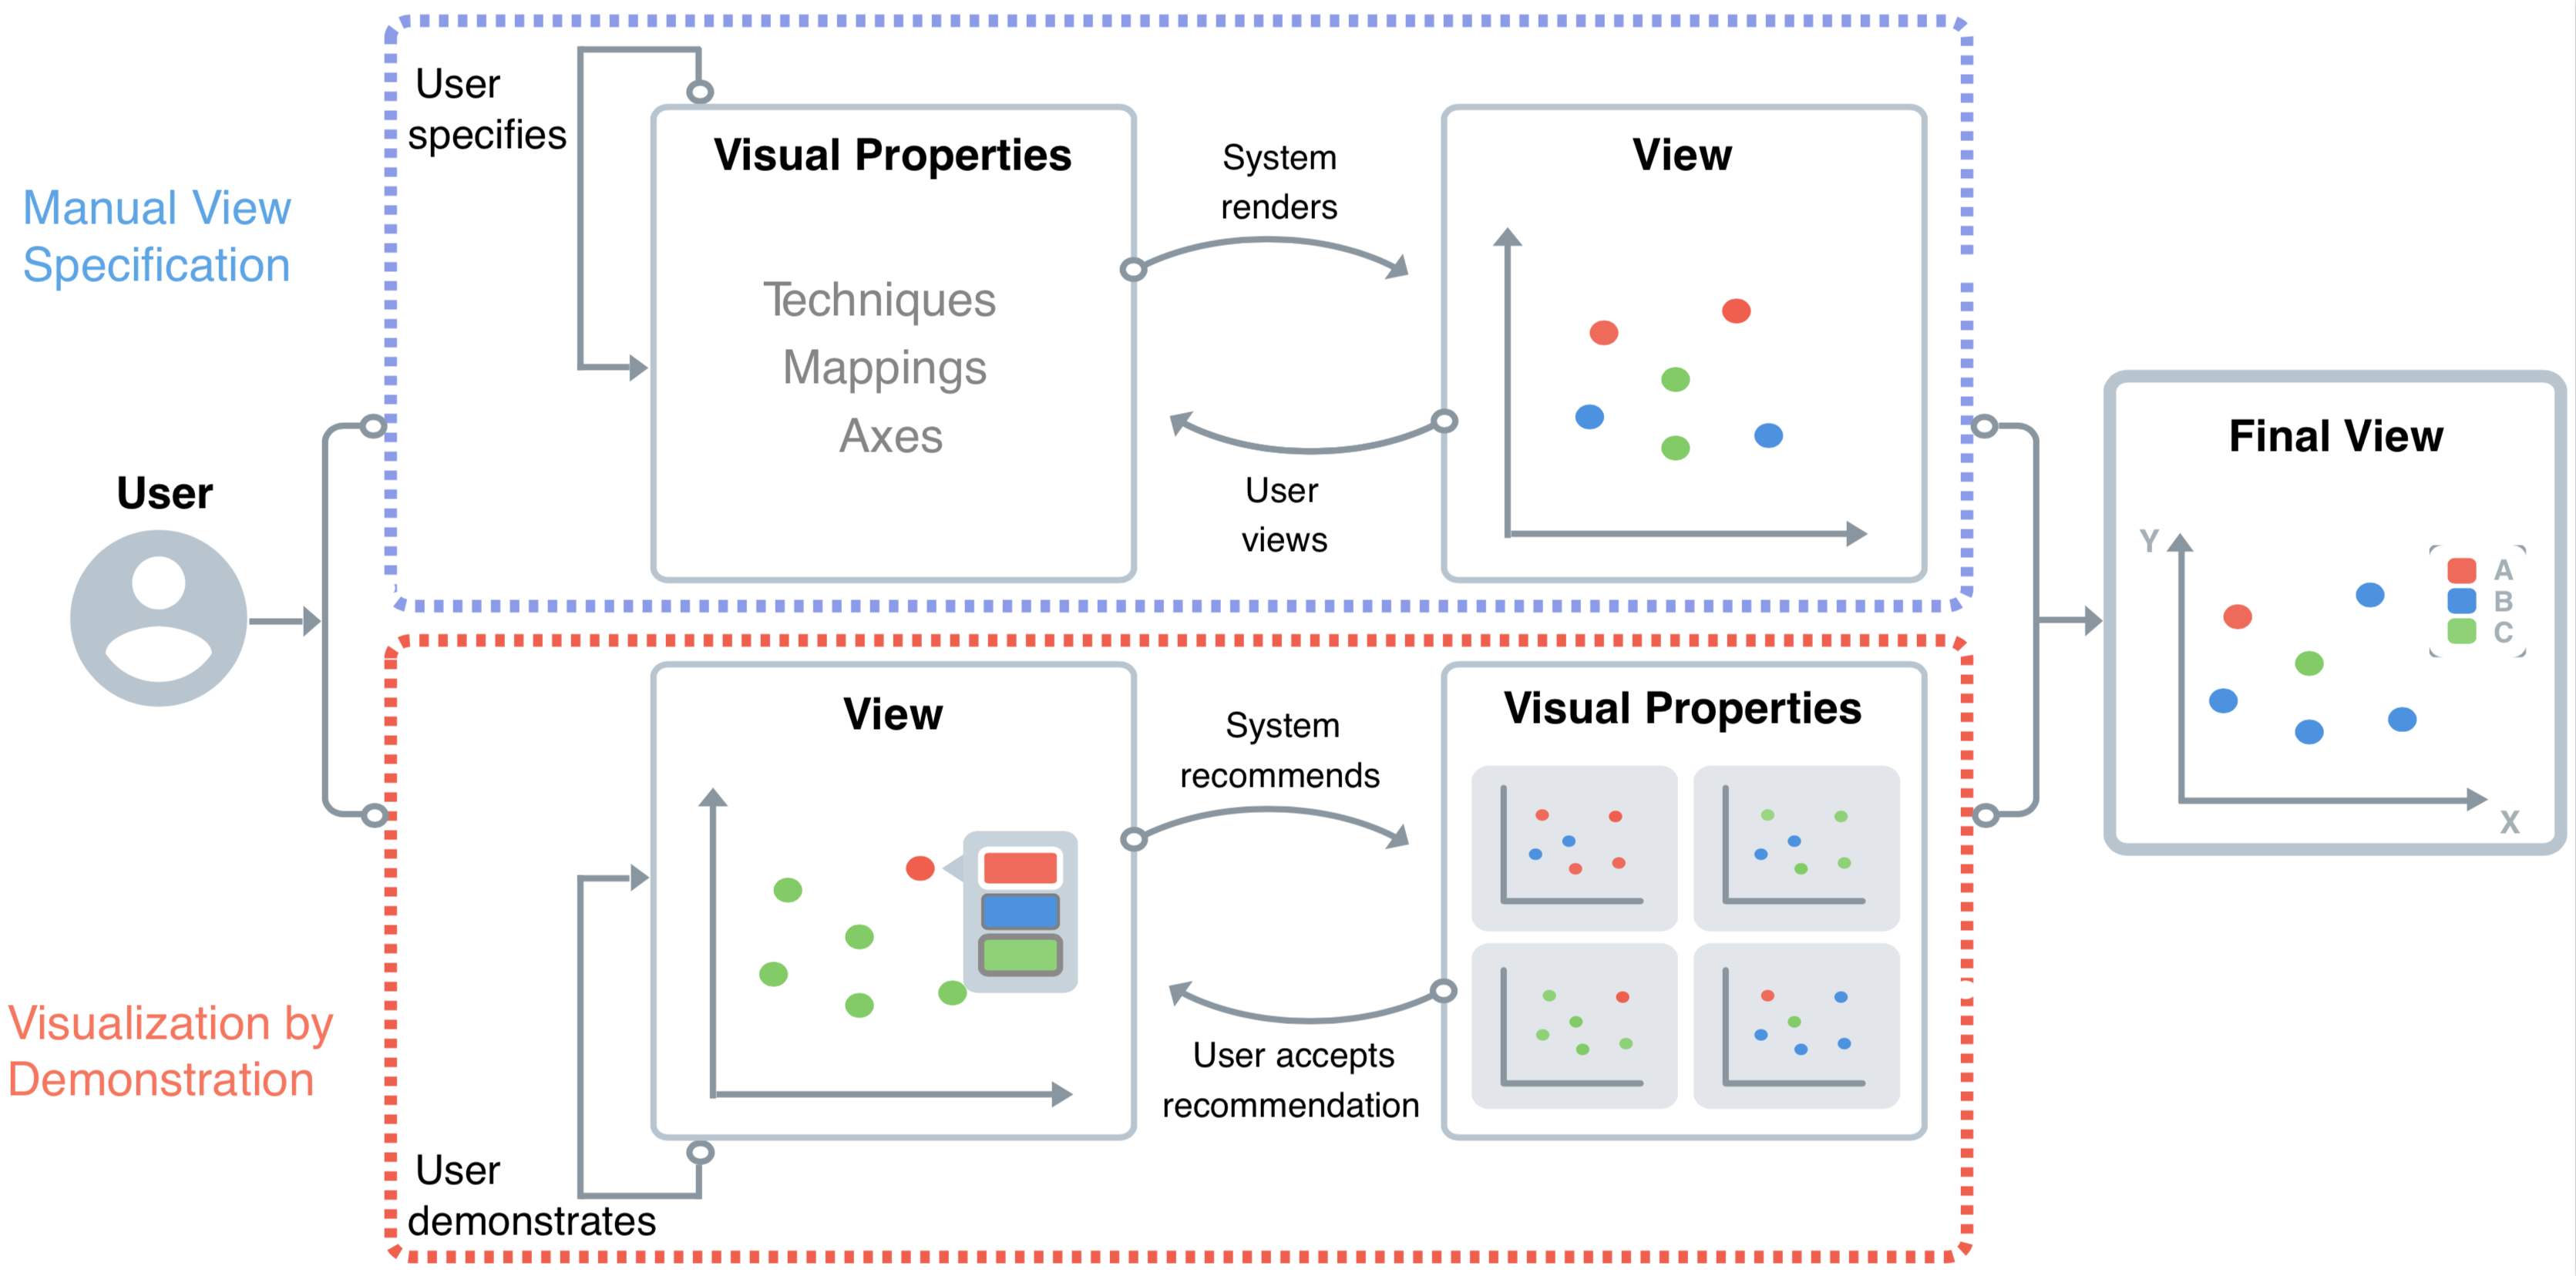
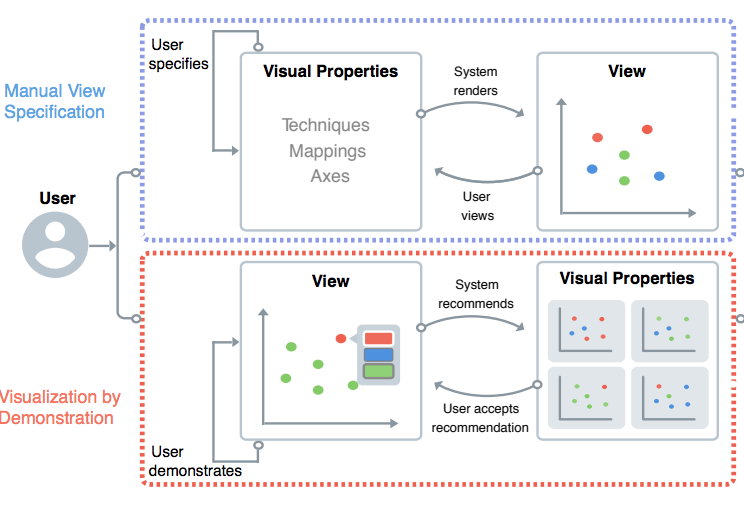
The proposed research will create Visual Analytics by Demonstration prototypes, generalizable toolkits, and demonstration primitives to foster exploration and discovery in visual analytics. Instead of control panels that require users to directly parameterize analytic models and visualizations, people provide demonstrations, from which the system selects the appropriate visual representation, analytic model, and parameters. To realize the benefits of such technology, many research challenges exist and must be addressed. For instance, what are the basic demonstration primitives that people use to communicate their intent to a system? How can systems interpret these demonstrations and perform the correct analytic and visualization operations? Finally, how can these systems guard against potential user bias in exploring data using by-demonstration? Project objectives include the design, implementation, and evaluation of by-demonstration visual analytic prototypes. The research will perform formative studies to develop demonstration primitives categorized by user tasks. The project will design and develop applications for specific data domains as well as general, open-sourced toolkits for other researchers to use and extend. User studies will identify if and how specific tasks and operations can be performed by demonstrations, and how these compare in performance to current control panel interfaces. The proposed work will also create instructional material to integrate visual analytics by demonstration into courses that teach visual analytics, or data science more generally.
NEWS
- Bahador Saket gave an invited talk titled Visualization by Demonstration at the 2019 TRIPODS Southwest Conference
- Endert gave an invited talk at the 2018 Data Literacy for a STEAM Curriculum Workshop
- Endert's NSF CAREER Award supporting this project has been funded!
PEOPLE
- Alex Endert, PI
- Bahador Saket, Graduate Research Assistant
- Grace Guo, Graduate Research Assistant
PUBLICATIONS
Demonstrational Interaction for Data Visualization
IEEE Computer Graphics and Applications, 2019
Investigating Direct Manipulation of Graphical Encodings as a Method for User Interaction
IEEE Transactions on Visualization and Computer Graphics (InfoVis), 2019
Investigating the Manual View Specification and Visualization by Demonstration Paradigms for
Visualization Construction
Computer Graphics Forum (EuroVis), 2019
Graphiti: Interactive Specification of Attribute-based Edges for Network Modeling and
Visualization
IEEE Transactions on Visualization and Computer Graphics (Proc. VAST'17), 2018
Evaluating Interactive Graphical Encodings for Data Visualization
IEEE Transactions on Visualization and Computer Graphics, 2017
Visualization by Demonstration: An Interaction Paradigm for Visual Data Exploration
IEEE Transactions on Visualization and Computer Graphics (Proc. InfoVis'16), 2017
DOWNLOADS
PROJECT INFORMATION

Title: CAREER: Visual Analytics by Demonstration for Interactive Data Analysis
Duration: 5/2018 - 5/2023
PI: Alex Endert
Students: Bahador Saket, Grace Guo
Last updated: March 6, 2020